
A claim is being spread across social media by leaders of the Aam Aadmi Party that the power outage rates in Delhi and Punjab were the lowest in the country, even as the party is providing “free 24×7 electricity”. The claim comes in the backdrop of the Punjab State Electricity Regulatory Commission (PSERC) announcing an increase in the tariff by 25 to 89 paise per unit for different categories.
From May 16, power consumers will feel the pinch due to the increase in the tariff by 25 to 89 paise per unit for different categories, even as the Aam Aadmi Party won the Jalandhar Lok Sabha bypoll.
Claim:
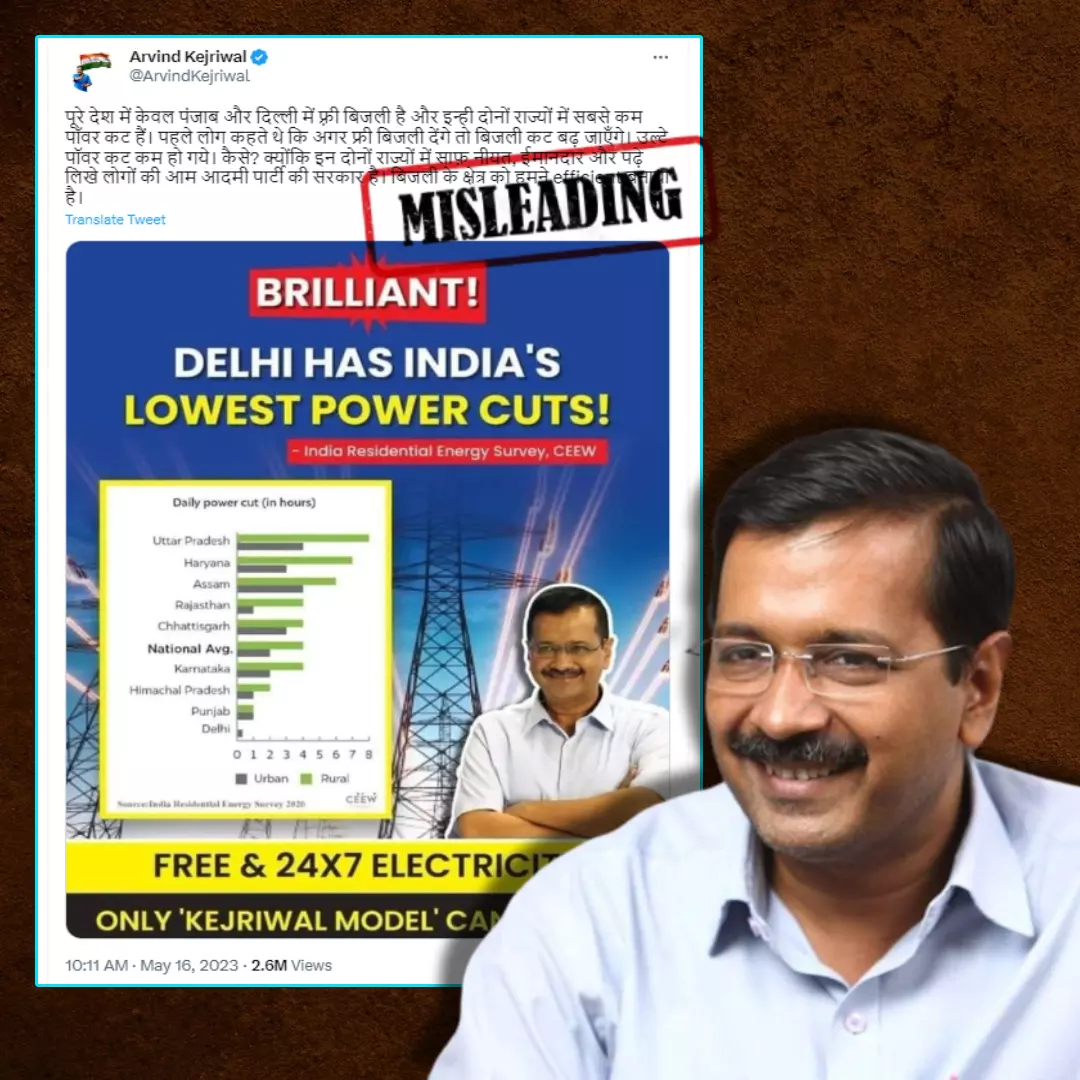
Delhi Chief Minister and AAP supremo Arvind Kejriwal shared an image which shows a graph illustrating the daily power cut in hours across different states such as Uttar Pradesh, Haryana, Assam, Rajasthan,Chattisgarh, Punjab and Delhi. The graph showed that Delhi had the least hours of power cuts, followed by Punjab. Uttar Pradesh and Haryana were the worst in terms of power cuts.
The text on the image reads, ‘Brilliant! Delhi has India’s Lowest Power Cuts’ and tags ‘India Residential Energy Survey, CEEW’ as the source.
The claim by Kejriwal reads, “Only Punjab and Delhi have free electricity in the whole country and these two states have the least number of power cuts. Earlier people used to say that if free electricity is given then power cuts will increase. On the contrary, the power cuts have reduced. How? Because in both these states there is a government of Aam Aadmi Party of clear intention, honest and educated people. We have made the electricity sector efficient.”
Other persons and pages associated with AAP shared this claim across social media.
Fact Check:
At the bottom of the viral image a source reads, ‘Source: India Residential Energy Survey 2020’. Taking a cue from this, we conducted a keyword search which led us to the report uploaded on the website of the Council on Energy, Environment and Water. The CEEW is a non-profit policy research institute that works on environmental change, use, reuse, and misuse of resources.
As per the description on the webpage, the report is described as “The Government of India’s efforts in providing electricity access to the country’s population has been commendable. Using the nationally representative India Residential Energy Consumption Survey (IRES), this study undertakes an independent assessment of the quality and reliability of power supply and consumer satisfaction with electricity services.”
The India Residential Energy Consumption Survey (IRES) is a pan-India survey on the state of energy access, consumption, and energy efficiency in Indian homes, the CEEW notes. The report spans nearly 15,000 households in 1210 villages and 614 wards in 152 districts across 21 states.

As can be seen on the first page, the report was published in October 2020. Page 16 of the report mentions that the survey was designed, planned and executed from March 2019 to April 2020. The data for the survey was collected between November 2019 and March 2020.
During this period, Captain Amarinder Singh of the Congress party was Punjab’s Chief Minister.

We then browsed the report further and came across the original graph. Comparing this graph with the viral image, we found that the viral image is altered.
Jharkhand can be seen below Uttar Pradesh in the original survey however it appears to be gone from the viral one. Tamil Nadu, Gujarat, Kerala, and Bihar appear to be missing from the viral graph as well.

This placed Punjab as the second last state in the viral graphic. We gleaned from the original graph that even as per the 2019-2020 data, Punjab was not the second-lowest in terms of power outage rates.
Also, the worst-performing states listed in the original report’s graph are Uttar Pradesh, Jharkhand, and Haryana. Meanwhile, the viral graph shows just UP and Haryana. The graph shared by Kejriwal mentioned the “National Average.” In the report’s graph, this is listed as “India.”
The CEEW report added, “An average Indian household receives 20.6 hours of power supply from the grid. The average daily supply in urban areas (22 hours) is longer by a couple of hours than in rural areas (20 hours). Delhi, Kerala, and Gujarat are the top states, maintaining slightly over 23 hours of average supply in both urban and rural areas. In contrast, households in Uttar Pradesh, Jharkhand, Haryana, Assam, and Bihar face the longest power outages, with rural households in these states facing six or more hours of daily outages.”
Conclusion:
We found that the viral graphic shared by Kejriwal is altered. The graph dates back to October 2020 and the viral image was edited so as to exclude several states in the original graph. Thus, Delhi CM Kejriwal and AAP supporters shared a manipulated graph to propagate the misleading claim that Punjab and Delhi have the lowest daily power consumption.
If you have any news that you believe needs to be fact-checked, please email us at factcheck@thelogicalindian.com or WhatsApp at 6364000343.
Also Read: Does The Viral Video Show A man Floating With The Power Of Yoga? No, Viral Claim Is Misleading
https://thelogicalindian.com/h-upload/2023/05/19/500x300_231619-new-project-2023-05-19t122742146.webp
Fact Check
2023-05-19 10:10:30.0
Does Punjab Have Lowest Number Of Power Cuts? No, Delhi CM Kejriwal Shares Old And Manipulated Graph


